A ball falls to the ground and bounce.
It will fall after reaching the ceiling if you throw it up.
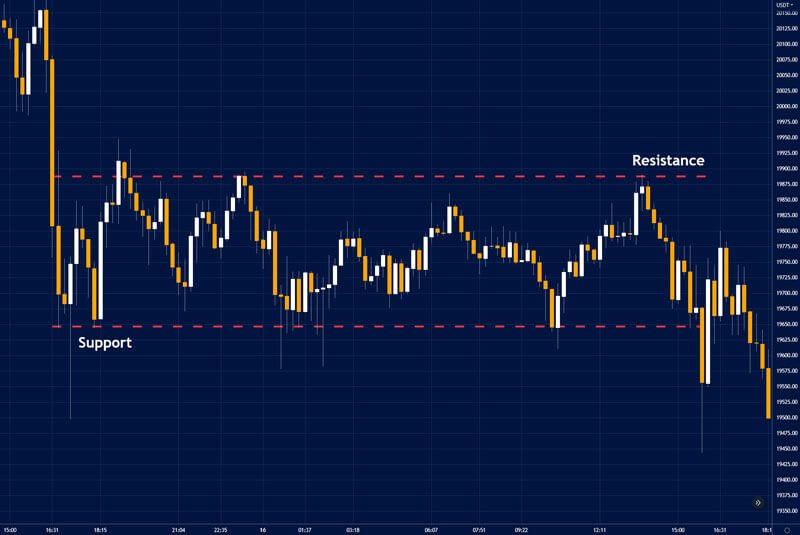
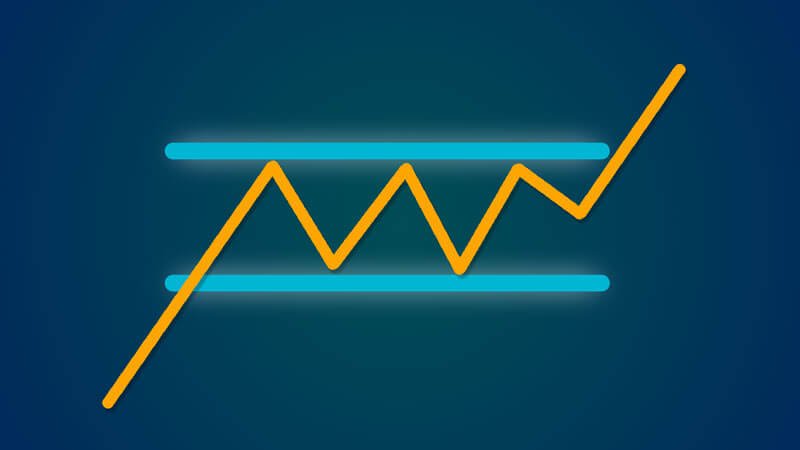
Prices are positioned between support and resistance, which are similar to a floor and a ceiling.
Price changes must be understood in the context of support and resistance.
Depending on how strong they are, you can determine if the trend is likely to continue or turn around.
Support
Support is a price level when purchasing power is sufficient to break or reverse a downward trend.
As a diver strikes the bottom and pushes away from it, a downtrend that has support bounces when it does so.
On a chart, support is shown as a horizontal line joining two or more bottoms.
Learn more about Strenght of Support and Resistance.
Resistance
A price level known as resistance is one where selling pressure is high enough to halt or reverse an upward trend.
A man climbing a tree who strikes his head on a branch slows and may even fall when an uptrend encounters resistance.
On a chart, resistance is shown as a horizontal line joining two or more tops.

In areas of congestion, draw horizontal lines along the upper and bottom boundaries.
The final result indicates the strength with which buyers prevail over sellers.
Areas of support and resistance frequently alter places.
Watch out for fake breaks through both support and resistance.
Professionals typically fade (trade against) breakouts while novices tend to follow them.
Instead of drawing support and resistance lines across extreme prices, it is preferable to do so around the margins of the congested areas where the majority of the bars halted.
While the extreme points merely represent panic among the weakest traders, those congested zones show where large numbers of traders have altered their thoughts.
Trends can stall or reverse depending on the strength of minor or large support or resistance.
Trading results in a self-fulfilling prophesy since traders purchase at support levels and sell at resistance levels.
How can we spot trends?
Not based on trends. Exponential moving averages, which we’ll discuss in the following section, are among my favorite tools.
Trendlines are among the most deceiving tools because they are so wildly subjective.
Computerized analysis is far superior to traditional charting in the area of trend identification.


